Bitcoin Shows Signs of Bullish Reversal: Analyzing the Latest Trends
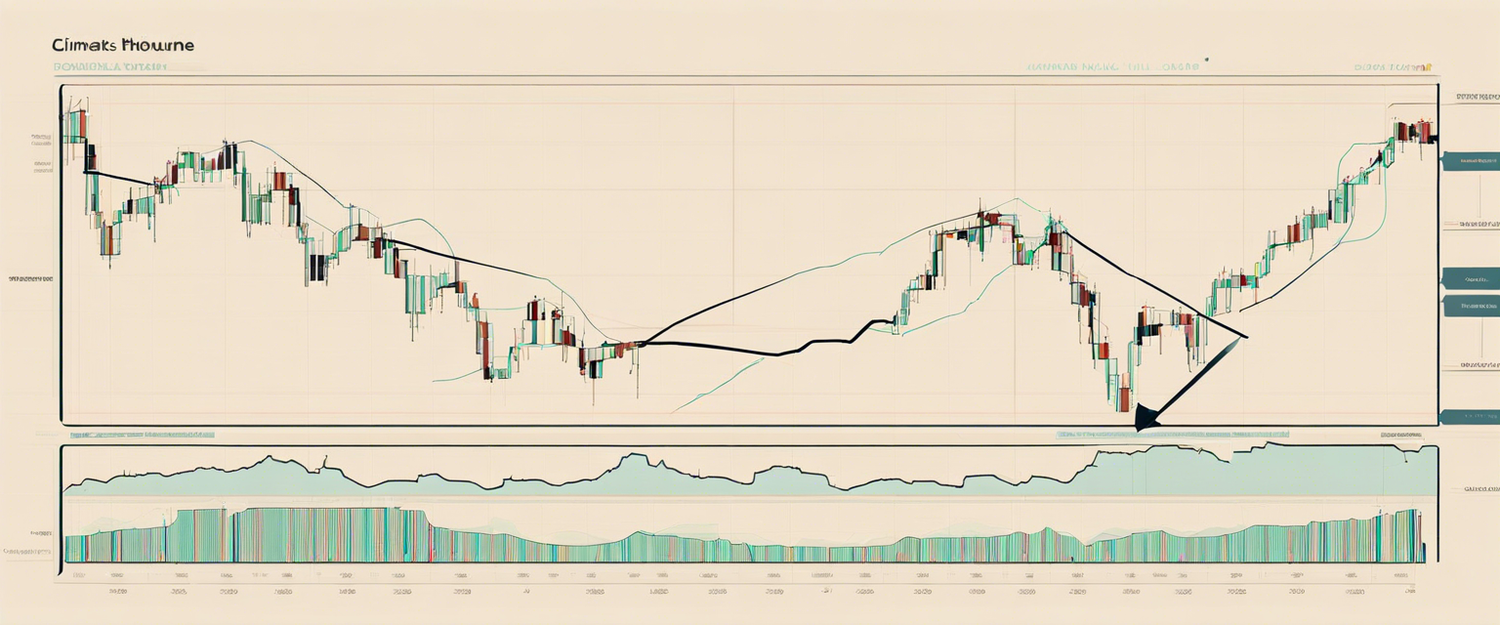
According to CoinDesk, Bitcoin's three-line break chart is suggesting a bullish resolution to a seven-month-long corrective trend, indicating a potential move towards record highs. Despite experiencing a recent rally, Bitcoin's daily candlestick chart indicates that prices are still trapped within a descending channel.
Recent Performance of Bitcoin
Bitcoin, the leading cryptocurrency by market value, recently rose over 5% to $66,000, marking its largest single-day gain since August 23, as per CoinDesk Indices data. However, the daily candlestick chart reveals a more neutral outlook, reflecting that Bitcoin remains constrained within a descending channel defined by trendlines connecting highs from March and June, and lows from May and July.
Insights from the Three-Line Break Chart
The critical takeaway from the three-line break chart is that the breakout of the prolonged descending channel occurred on Monday, resuming a broader uptrend from the October 2023 lows near $30,000. This bullish signal raises expectations that Bitcoin could reach record highs above $73,000.
The three-line break chart is particularly useful for traders as it filters out erratic price movements and noise while gauging ongoing trends and potential reversals. A bullish reversal on this chart is indicated by a new green bar when the price exceeds the highest point of the last three red lines. Conversely, a new red line signifies a bearish reversal when the price dips below the lowest point of the previous three green lines.
What Does the Current Chart Reveal?
A bullish continuation is confirmed when the price rises above the previous green line, which occurred this past Monday when the green bar cut through the trendline from March and April highs. This suggests growing momentum and optimism among traders.
Cautionary Aspects for Traders
While the breakout on the line break chart hints at a potential rally to new heights, it is crucial for traders to exercise caution. There are two significant factors to consider:
- Resistance Levels: Historical performance shows that bulls have struggled to sustain prices above $70,000 since March, indicating a possible resistance level that could hinder upward momentum.
- Monitoring the Line Break Chart: Traders should keep an eye on the potential for bullish invalidation on the line break chart, which would be represented by a new red bar taking prices back inside the channel. Failed breakouts could lead to deeper price slides, reminiscent of trends observed in late September.
Conclusion: What Lies Ahead for Bitcoin?
As Bitcoin navigates through these market dynamics, understanding the indicators and applying strategic caution may help traders capitalize on potential gains while minimizing risks. Observing the resistance levels and the three-line break chart's developments will be crucial in deciding the next course of action for both investors and traders.
For more insights on cryptocurrency trends and trading strategies, visit our Crypto Analysis Page.


Lasă un comentariu
Toate comentariile sunt moderate înainte de a fi publicate.
Acest site este protejat de hCaptcha și hCaptcha. Se aplică Politica de confidențialitate și Condițiile de furnizare a serviciului.